醬是創客的WebThings教學主題第7篇,以WebThings Gateway搭配Raspberry Pi樹莓派來實作教學,本篇教學將著重紀錄Log數值與查看曲線圖,有了連續數值後,我們可以方便查詢過去的歷史紀錄,並知道設備狀況
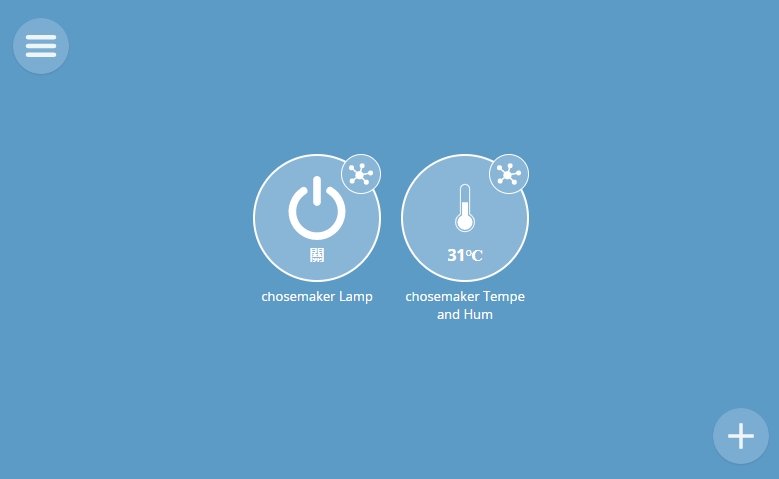
本篇文章基於WebThings教學#1~5,請先閱讀完並設定好你的ESP32與樹莓派後再開始進入此篇,首先請先確認儀表板的圖示如下
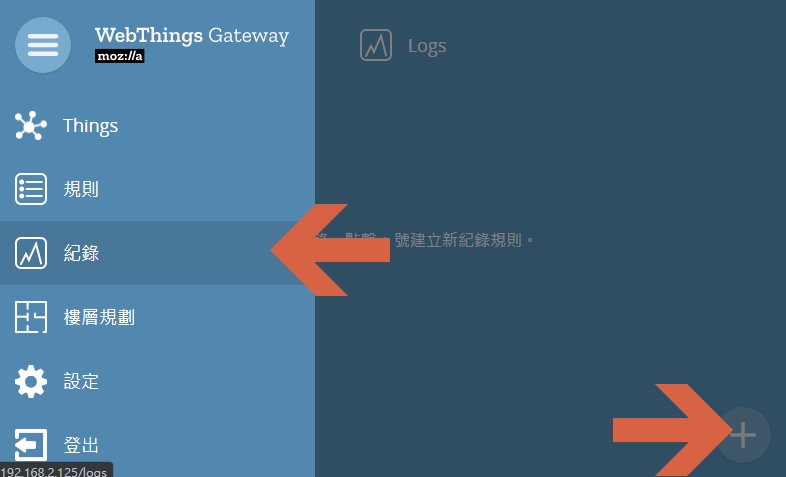
到選單的紀錄,並點選右下角來加入紀錄的profile
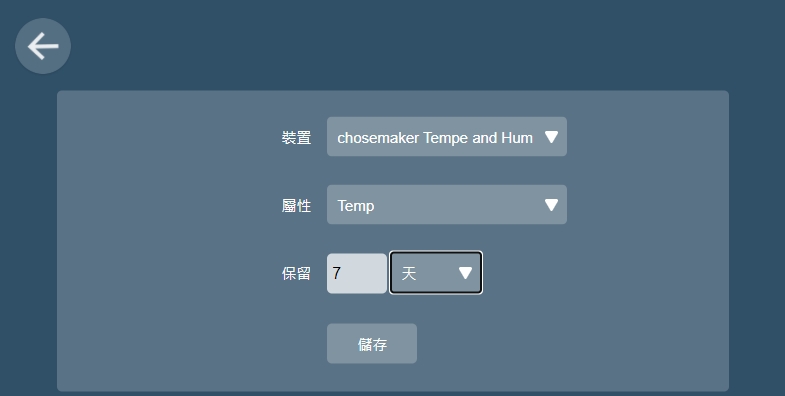
要記錄chosemaker Tempe and Hum的溫度,並指保留7天數據,由於Webthings是將資料放於sqlite3資料庫,這部分需請自行評估IO rate部分計算可以容納多少設備同時寫入
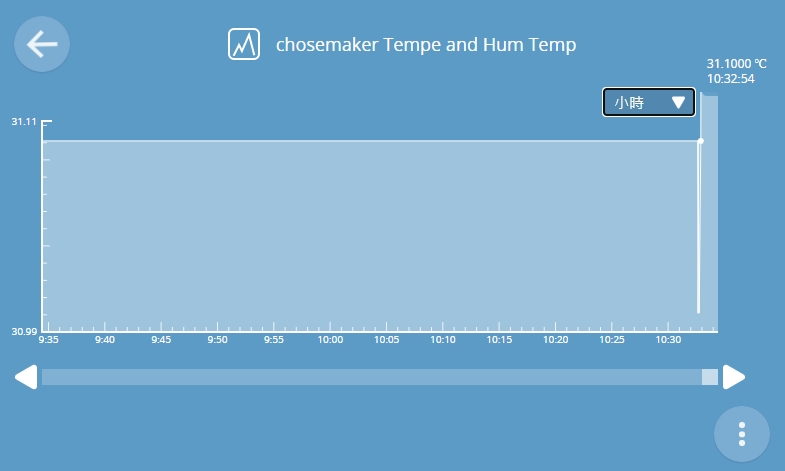
接著點入chosemaker Tempe and Hum,即開始繪圖,可以選分/小時/天來查看連續數職的曲線